Automatically detect vulnerabilities trying to creep into your builds
Security breaches, license issues, and denial of service attacks are all vulnerabilities that put your production systems at high risk every day! JFrog Xray makes your life easier by performing artifact analysis for you, enabling vulnerability detection before your code is harmed. How about automating this analysis process and integrating it into your CI/CD? This can certainly help you manage the many vulnerabilities that Xray exposes, and here’s how you can do it.
JFrog Xray lets you create Watches that trigger alerts, providing you with the data you need, accessible directly from within its friendly UI. However, there are many artifacts that make up a build, and this can translate into many alerts which are difficult to handle manually. To facilitate automation, Xray offers an extensive REST API that lets you automate your processes.
Xray provides a number of REST API calls that will improve your automation experience and enable you to get the info you need without having to access the UI.
What’s in my build?
The first capability we’ll look at enables us to create a graph for any artifact or build that’s indexed by Xray. This shows the connections an artifact/build is made up of, indicating the impact it has on other artifacts/builds in your system. These are the Artifact Component Graph and Build Component Graph APIs which get the full path of our artifacts (which includes the repository and Artifactory ID) and the build data (which includes the build name, number and Artifactory ID). The response JSON file contains the basic details of the requested artifact/build and all the components contained within them presented in a hierarchical (tree) structure. These API calls are parallel to the Component Details and graph of dependencies that are also available from within the UI.
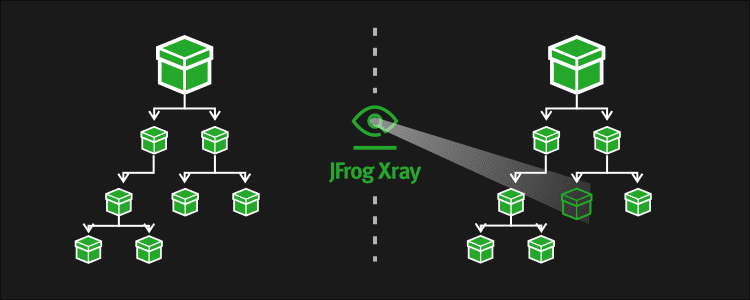
Diff is no longer reserved for source code
Another capability is the ability to compare 2 artifacts or builds (i.e. do a “diff”) using the Artifacts Dependency Delta and Builds Dependency Delta APIs. This lets you identify the difference between two artifacts or builds, and therefore focus on a new component with a vulnerability that triggered an alert. The response contains 3 parts:
- The artifacts contained in one build (the “target”) and not in the other build (the “source”)
- The reverse – The artifacts contained in the other build (the “source”) and not in the first build (the “target”)
- The artifacts common to both builds
This provides a clear representation of the differences between the two builds, enabling you to identify exactly where your issues are.
Sum it up for me!
Finally, let’s complete the picture with the Artifact Summary and Build Summary APIs which provide an elaborate summary for a specific artifact/build. This includes a list of licenses and vulnerabilities contained within the artifact/build. Moreover, a list of affected components for each license and vulnerability. This information is also available in several places from within the UI.
Combining these REST API calls can produce some really cool data analysis implementations for vulnerability detection. For example, you can find dependency versioning conflicts, and identify which component upgrade might have created issues in your staging environment, or even in your production environment!
Interested in more? Visit the JFrog Xray User Guide.
Ready to give Xray a try? Download Xray
Read about the Log4j Log4shell volnurability


