Historical Data and your Instances’ and Repositories’ Future
I never liked history in school. I was more interested in the latest technological developments and what the future had in store. What I didn’t realize at that time was age-old saying that (paraphrasing) you have to know your history to understand where you’re going. The same is true of your Artifactory instances and repositories. Knowing how they behaved can provide many different insights into what to expect from them in the future. Mission Control’s new Graphs feature gives you just that.
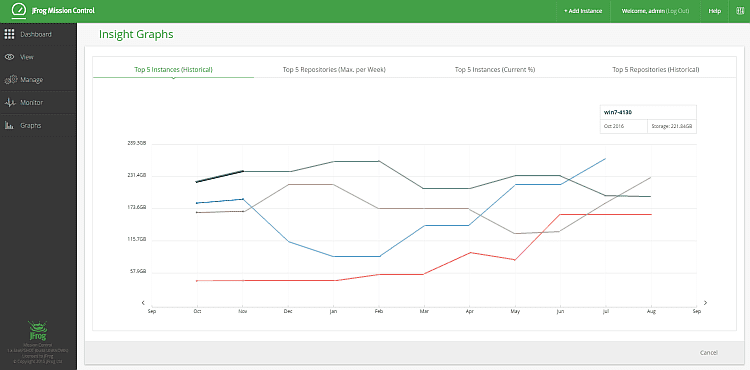
Scale Up or Clean Up?
The “Top 5 Instances (Historical)” graph shows the five Artifactory instances managed by Mission Control that used the largest amount of storage over any historical time period. As long as these graphs remain more or less horizontal over time, you’re probably OK, but if you see one of the instances continuously increasing the amount of storage it’s using, you should pay attention. If the trend continues, that instance will run out of storage at some point in the future. You can drill down and view the instance’s Storage Summary Tab in Mission Control’s Monitoring module, to see what’s happening. If there’s just a general increase of usage, you could plan to move that instance to S3 or Google Cloud Storage (or increase its bucket size if it’s on cloud storage already). Alternatively, it may be enough to just empty the Trash Can on the instance. If the increased usage is concentrated in a group of repositories, you might have a word with the development teams on site, or perhaps implement stricter cleanup policies. The point is, with this historical data in front of you, you can take action before storage becomes scarce in any instance.
Focusing on Repositories
The “Top 5 Repositories (Historical)” graph shows the five repositories (in any of the instances managed by Mission Control) that used the largest amount of storage over any time period. This is very similar to the “Top 5 Instances (Historical)” graph, however it focuses on historical data for repositories. Both of these “Historical” graphs let you zoom in to any time period to investigate any unusual activity more closely. The example below shows historical data zoomed in on hourly usage over a 24 hour period.
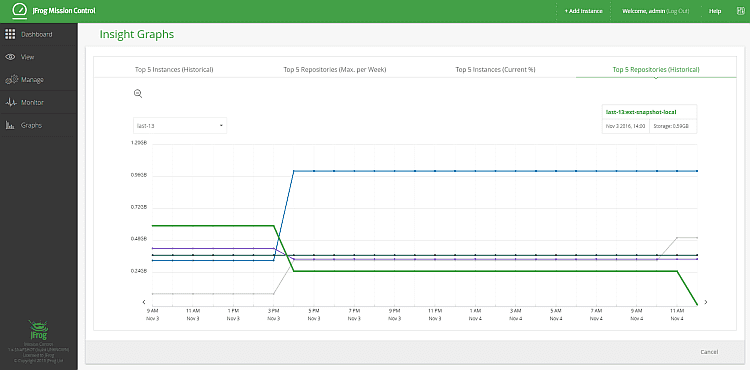
This graph will immediately show you any repository whose usage is growing steadily. Possibly the team using the repository suddenly grew, and perhaps needs another one allocated. Perhaps Dev and QA should use separate repositories. Either way, you can prepare your systems ahead of time before the growing repository becomes a problem.
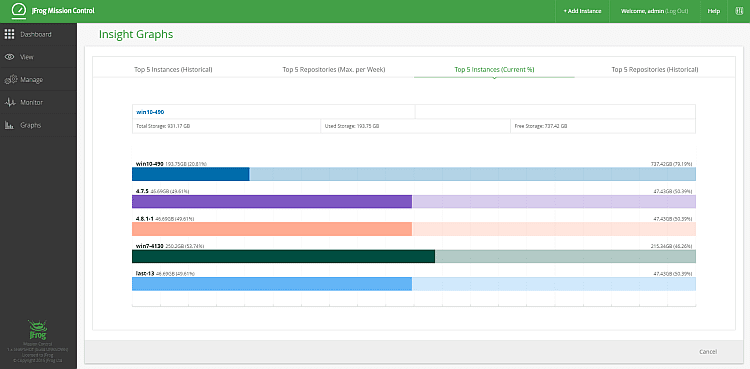
Real Time Red Alerts
The “Top 5 Instances (Current %)” graph shows the five instances that are using the highest percentage of their available storage. You can select the bar for any instance to see the details of its available and used storage, and if any instance uses more than 80% of its available storage, the bar will be in a glowing red color. This might be a good time to contact that Artifactory administrator (if it’s not you) and see how to manage the situation. Either you can clean up some artifacts, or increase available storage for that instance.
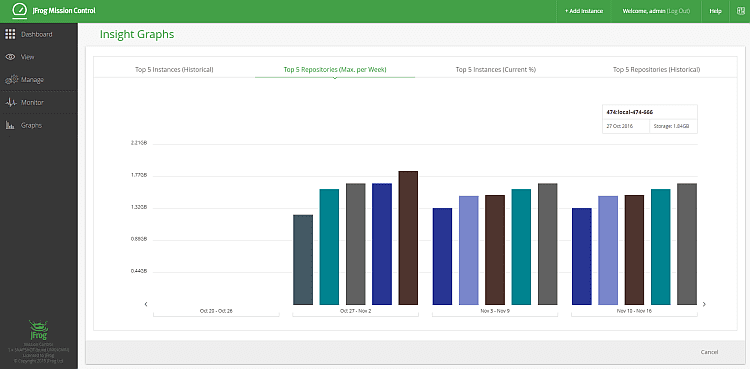
Where’s the repository bloat?
The “Top 5 Repositories (Max. per Week)” graph shows the five repositories (in any of the instances managed by Mission Control) whose peak storage used over a week is greatest. If the same repository “is featured” in this graph on different weeks, it is displayed in the same color. This gives you an easy way to spot some increasingly heavy activity in a particular repository. Since the graph displays peak storage during the week you may want to investigate any bursts of activity with project teams using that repository. The solution may be spreading activity more evenly over the week, or just allocating an additional repository.
These graphs are just the first step to making Mission Control smarter. Down the line, you can expect more graphs to be added, and while currently, you need to investigate increased activity yourself, in the future, Mission Control will provide more detailed information that will offer a solution.
Want Insight Graphs? Download JFrog Mission Control.


