
Love Your Logs. It Pays Off

“My Artifactory won’t start”; “I see some lag”; “My artifacts are missing”; “I get issues when Jenkins tries to pull/deploy artifacts”; “I am getting 404 / 401/ 403/ 500 /409” … These are just a few of the common issues I hear from our customers. Very basic issues; right? We can triage them in a matter seconds… provided we have the right pieces of information. And indeed we do! All this information can be found in logs. This is why every developer and DevOps engineer should be in love with log files; this is love that really pays off. In this post, I’ll go through the extensive log information you have access to when using Artifactory.
As developers and DevOps engineers, we all write applications and scripts to automate all the tedious, manual tasks we have to perform. It makes us more efficient and productive. As a best practice, we include a lot of debug information as part of our code and leverage it to quickly mitigate any issues that may arise.
The same is true of Artifactory. As an enterprise application, Artifactory generates detailed logs as part of its basic architecture. Using the Logback Framework, Artifactory logs activity according to type in four different log files which can be found under the ARTIFACTORY_HOME/logs folder:
- artifactory.log
- access.log
- request.log
- import.export.log
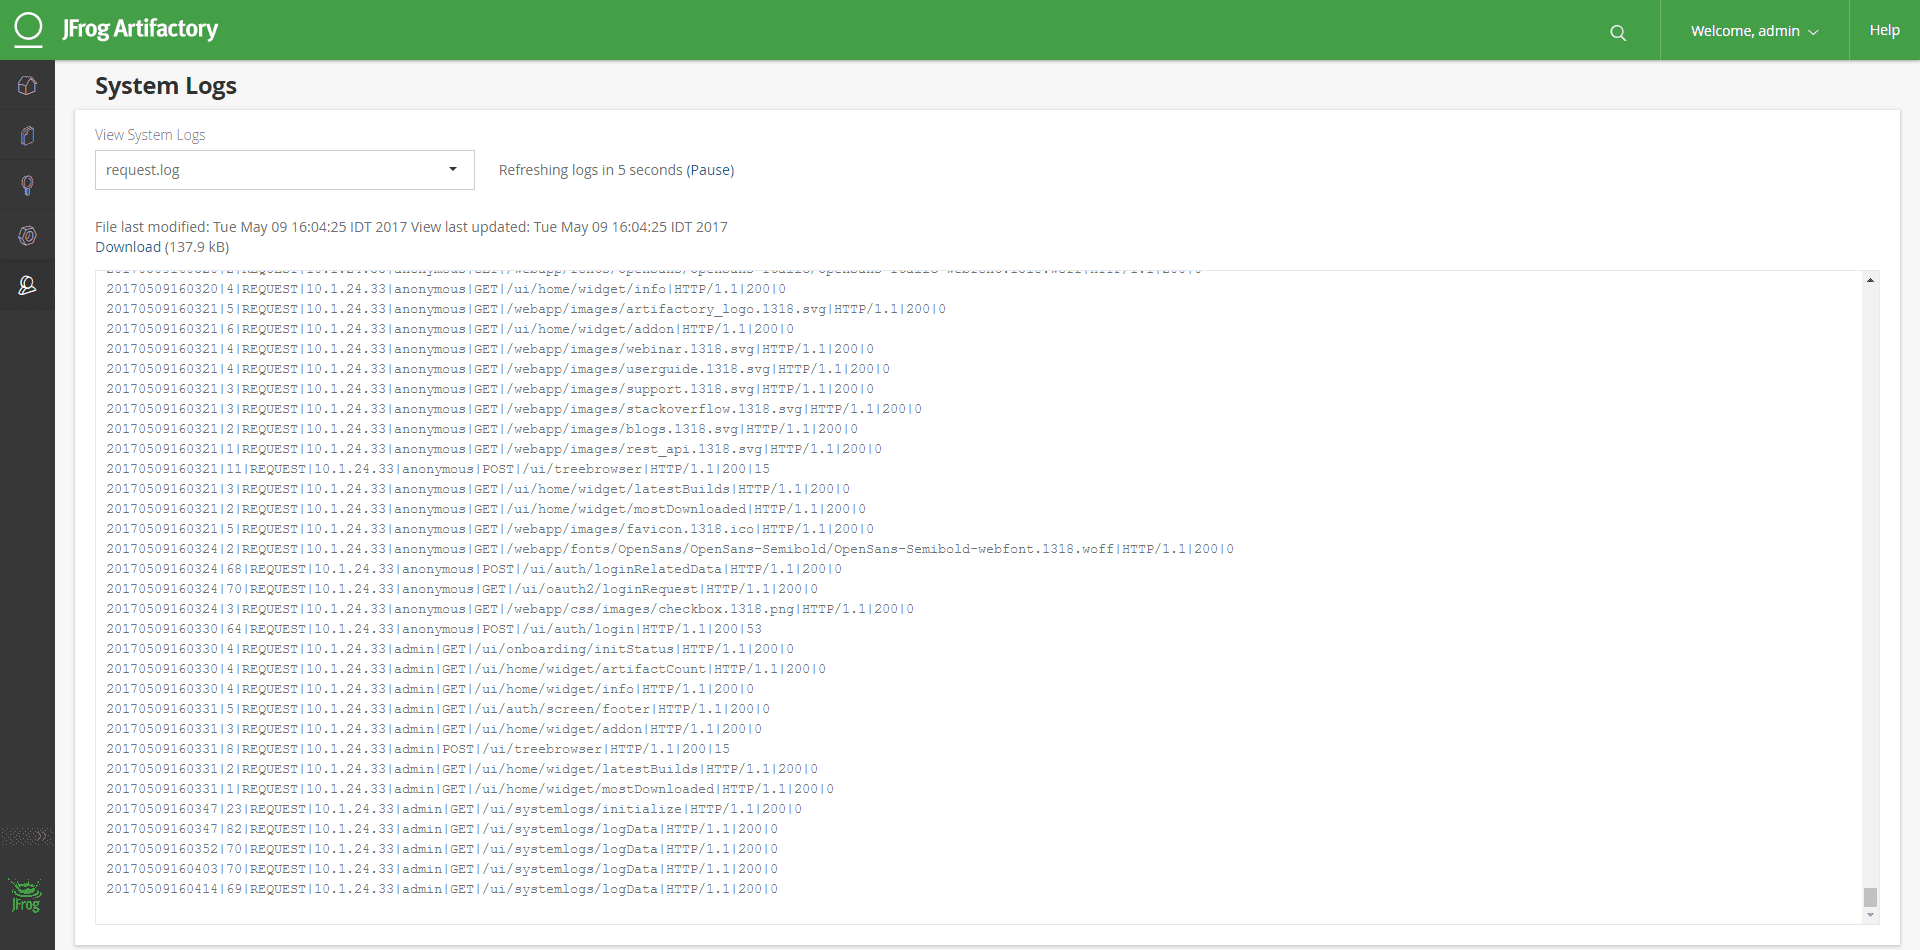
You can view any of these logs from within the Artifactory UI, or access them directly from your file system. But there’s more. Because Artifactory runs inside a tomcat container, you also have access to Catalina logs, and for next level debugging you can also activate traffic.log to monitor traffic and for auditing purposes.
Log File Verbosity
The verbosity of any logger in your system can be configured by entering or modifying the level value in the corresponding entry in the Logback configuration file, ARTIFACTORY_HOME/etc/logback.xml.
For example:
<logger name="org.apache.wicket">
     <level value="error"/>
</logger>
In the rest of this post, I’ll show you how to make the best of Artifactory and related log files.
The Application Monitor: artifactory.log
The artifactory.log file is your main application log. It starts with the application and ends with the application. All the events that occur from startup to shutdown, as well as system error information can be found in this log. This is the key file to monitor when starting up Artifactory. Because Artifactory interacts with many components (database, storage [NFS / Object / DAS / NAS], load balancer, reverse proxy and in most cases network proxy) there are are many potential points of failure, and artifactory.log is the place to look if something goes wrong. Whether your Artifactory installation is an independent instance or a highly available cluster, this log file captures it all, and by analyzing it, you can mitigate 95% of all startup issues.
The Gatekeeper: access.log
Artifactory’s access.log is your go-to authentication log. It contains a full list of authentication requests providing important information about each one, whether accepted or denied. These include download requests, configuration changes, password resets, etc. Whether the request comes through the GUI, REST API or CLI, this log captures every aspect of the request – who, when and where – in an explicitly columnized structure so you can easily run a log parser against it to gain further insights. And in case you didn’t know, Sumo Logic is integrated with Artifactory out-of-the-box and is described in more detail below.
How Much and How Many: request.log
Artifactory’s request.log can be considered to be a sibling of the Apache HTTPd request log. It is the place to monitor traffic, usage, requests and any other operation done within Artifactory. Like the other log files, this one is also columnized for easy analysis by log parsers.
What comes in, what goes out: import.export.log
As the name suggests, Artifactory’s import.export.log is the log that captures all events and activities related to the import and export of the system. Import and export can be scheduled, and any issues occurring for this can be mitigated by analyzing this log file.
Beyond Artifactory: Catalina logs
Because Artifactory runs inside a Tomcat container, activities related to Tomcat and servlets are captured in the default Catalina log files which will also include any uncaught exceptions displayed in a java.lang.ThreadGroup.uncaughtException(..). The Artifactory application thread dumps will also be in the Catalina logs which can be found under ARTIFACTORY_HOME/logs/catalina/
Log Analytics: From Logs to Insights
As mentioned before, Artifactory comes with Sumo Logic integrated out-of-the-box. To connect with Sumo Logic, all you need to do is fill out the relevant fields in the Artifactory UI.
If you don’t already have an account with Sumo Logic, Artifactory will automatically create one for you and start sending log data for analysis. The Sumo Logic data analytics platform will, in turn, display pre-enabled dashboards which can be customized as needed. This enables you to access Sumo Logic’s premium operational analytics directly from Artifactory, letting you index and analyze both structured metrics data and unstructured log data together in real time. You can then have a variety of dashboards such as Traffic by geo-location, Active IPs, Most active repositories, Top referred files, Requests by status codes, Denied login attempts and much more.
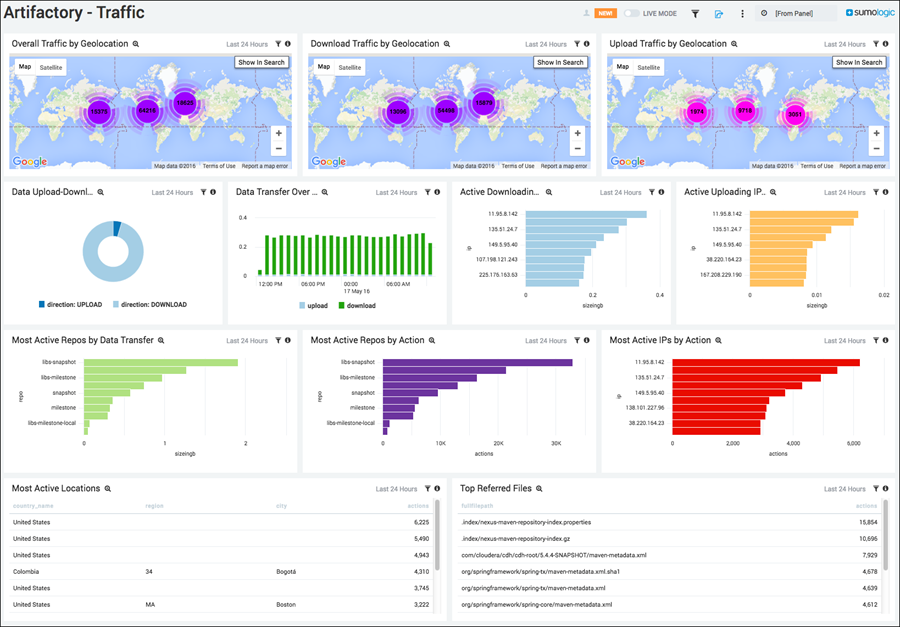
Source: Sumo Logic
Syslog Supported
If you prefer, you can configure Artifactory to consolidate and write log information to Syslog. All you need to do is configure the Logback library in three easy steps:
- Configure logback.xml
You need to edit the $ARTIFACTORY_HOME/etc/logback.xml file to send logs to the Syslog facility by adding an appender to Syslog.
<appender name="SYSLOG" class= "ch.qos.logback.classic.net.SyslogAppender">
  <syslogHost>localhost</syslogHost>
  <facility>SYSLOG</facility>
  <suffixPattern>[%thread] %logger %msg</suffixPattern>
</appender>
- Add the appender to the output.
Add an appender-ref tag to the end of the root section as shown below:
<root>
  <level value="info"/>
  <appender-ref ref="CONSOLE"/>
  <appender-ref ref="FILE"/>
  <appender-ref ref="SYSLOG"/>
</root>
Make sure to save the logback.xml file and note that you don’t even have to restart Artifactory for this change to take effect.
- Take care of sockets
Since logback uses internet sockets, you have to make sure that your Syslog facility accepts them. Modern Linux distributions use the rsyslog daemon for syslogging. Ensure that the configuration for internet domain sockets is enabled, either by editing /etc/rsyslog.conf and uncommenting the following code segment:
# Provides UDP Syslog reception
$ModLoad imudp
$UDPServerRun 514

# Provides TCP syslog reception
$ModLoad imtcp
$InputTCPServerRun 514
Alternatively, you could also copy the code segment into a file whose name has the suffix “.conf” and place it under /etc/rsyslog.d
For this change to take effect, you will need to restart the Rsyslog service using:service rsyslog restart
So there you have it. Artifactory offers tons of information in its different log files. All you need to do is open them – whether from within the application UI or in any text editor. From identifying critical errors to tracking different types of traffic to your Artifactory servers, log files are an extremely useful resource. If you love your log files and handle them correctly, they will love you right back and give you all the insights that you need.
Experience
JFrog Today
Discover how the JFrog Platform unites DevOps, DevSecOps and MLOps for secure, rapid software delivery.