Monitoring and Optimizing Artifactory Performance

As Artifactory usage increases, its resources can gradually become depleted, causing hiccups or hits in performance. When usage increases, so does the importance of monitoring your system and its historical data. Monitoring usage patterns is an essential first step to optimizing Artifactory and ensuring its stability. Here, we would like to share with you some guidelines and tips on monitoring and tuning Artifactory as well as its environment. There are essential resources that need to be monitored (and possibly tuned) which will be covered, this includes:Tomcat, HTTP Connections, the database, Java Virtual Machine (JVM), and storage.
Tomcat
Artifactory runs on Tomcat which uses the Apache HTTP client to handle HTTP requests. Tomcat maintains a pool of threads and allocates a single thread to handle each incoming request. As the pool of threads gets depleted, Tomcat will create more (up to the maximum specified by the maxThreads attribute) to handle additional requests that come in. If the number of requests exceeds the maxThreads value, requests will be queued (up to the maximum specified by the acceptCount attribute). Should this parameter be too high, requests waiting for a free thread may experience delays until threads become available to handle them. Should the acceptCount limit also be reached, Tomcat will throw “connection refused” errors for any additional requests until the required resources are eventually released. In turn, any new request, uploads, downloads, updates, etc., which could not acquire a thread, will fail. To avoid these performance hits and errors, you can increase the values of these attributes in the Tomcat’s server.xml file. The default value for maxThreads is 200, while acceptCount is set to 100. The sample server.xml file below shows increased values for these attributes.
<Connector port="8081" acceptCount="200" compression="off" connectionLinger="-1" connectionTimeout="60000" maxThreads="600" acceptorThreadCount="2" enableLookups="false"/>
Monitoring
Netstat: If you don’t have any monitoring tools set up, you can easily monitor your HTTP connection usage live by running the below netstat command (replace TOMCAT_PORT with your Artifactory’s tomcat port).
while sleep 5; do printf "$(date) HTTP Connections: $(netstat -latuen | grep TOMCAT_PORT | wc -l)"; echo; done
You may also specify which state you’d like to count. For example, you may count the number of ESTABLISHED states by running the following command (replace TOMCAT_PORT with your Artifactory’s Tomcat port)
while sleep 5; do printf "$(date) HTTP Connections : $(netstat -latuen | grep TOMCAT_PORT | grep ESTABLISHED | wc -l)"; echo; done
MBean for HTTP Connections: From version 4.12, Artifactory has exposed the HTTP connection MBean so that its usage can be tracked. This MBean can be found in each repository under:
org.jfrog.artifactory > Artifactory | HTTPConnectionPool > [Repo Name]: Attributes
To learn more, read our blog post about Artifactory MBeans integration.
Third Party Tools: A number of third-party tools can also be used to monitor HTTP connections and various other resources. JFrog’s Knowledge Base contains instructions for some of these tools including JConsole, JavaMelody, and Nagios. For the Artifactory Docker Container, there are several open source tools that can be used to monitor HTTP Connections, JVM usage, and more.
The graph below was generated with another tool called LogicMonitor. It clearly shows that the maximum number of threads available in Tomcat has been reached and is a good indication that you should consider increasing the maxThreads attribute in Tomcat’s server.xml file.
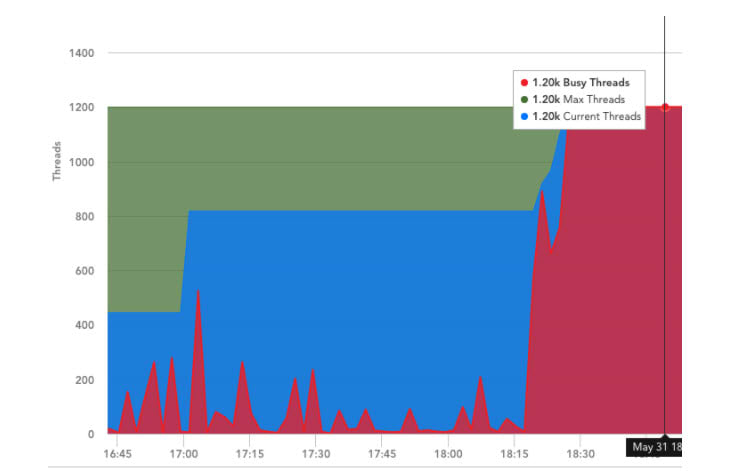
HTTP Connections for Artifactory
By default, the number of HTTP Connections allowed per repository is set to 50. If you notice that the number of connections used is consistently at or near this value, you can increase it by using the following parameter in the $ARTIFACTORY_HOME/etc/artifactory.system.properties file:
artifactory.http.client.max.total.connections = {value}
HTTP Connections if using S3
If you are using S3 Object Store to manage your filestore, you should be aware that Artifactory’s S3 binary provider is implemented using the Jets3t library which sets the maximum number of concurrent connections allowed to 100 by default. Under intensive activity with the filestore that requires many connections to the S3 Object Store, you may find that requests get stuck waiting for a connection from the JetS3t connection pool. To avoid this scenario, you should add the httpclient.max-connections property for the S3 binary provider in your $ARTIFACTORY_HOME/etc/binarystore.xml file. The code snippet below is a sample Cleversafe template taken from the Artifactory User Guide that shows how to set the httpclient.max-connections property:
<config version="v1">
    <chain template="s3"/>
    <provider id="s3" type="s3">
        <identity>XXXXXXXXX</identity>
        <credential>XXXXXXXX</credential>
        <endpoint>[My CleverSafe Server]</endpoint>
        <bucketName>[My CleverSafe Bucket]</bucketName>
        <property name="httpclient.max-connections" value="300"/>
        <httpsOnly>false</httpsOnly>
        <property name="s3service.disable-dns-buckets" value="true"></property>
    </provider>
</config>
For more information on tuning Tomcat, Netflix offers valuable insight in their blog, Tuning Tomcat For A High Throughput, Fail Fast System.
HTTP Connections for Reverse Proxy
If you are using a reverse proxy in front of your Artifactory, you may notice the number of HTTP connections reach its maximum value, preventing these connections from reaching Artifactory. In these cases, you should consider allocating more connections to your reverse proxy. For detailed instructions on how to do this, read the documentation for the reverse proxy server you are using. You can read about Tuning NGINX for Performance in the NGINX blog. For Apache, you can refer to Apache Performance Tuning in the Apache documentation. Similarly, you can refer to this Apache documentation for the Apache HTTPD reverse proxy.
Database
The number of database connections is another vital resource that should be monitored when optimizing Artifactory. Admins must be able to confirm that there are enough database connections available, otherwise, users may encounter hanging requests which are waiting for free connections. The number of database connections allowed should be tuned based on current usage, but keep in mind that this value should never exceed the maximum number of database connections configured in the database itself.
Monitoring
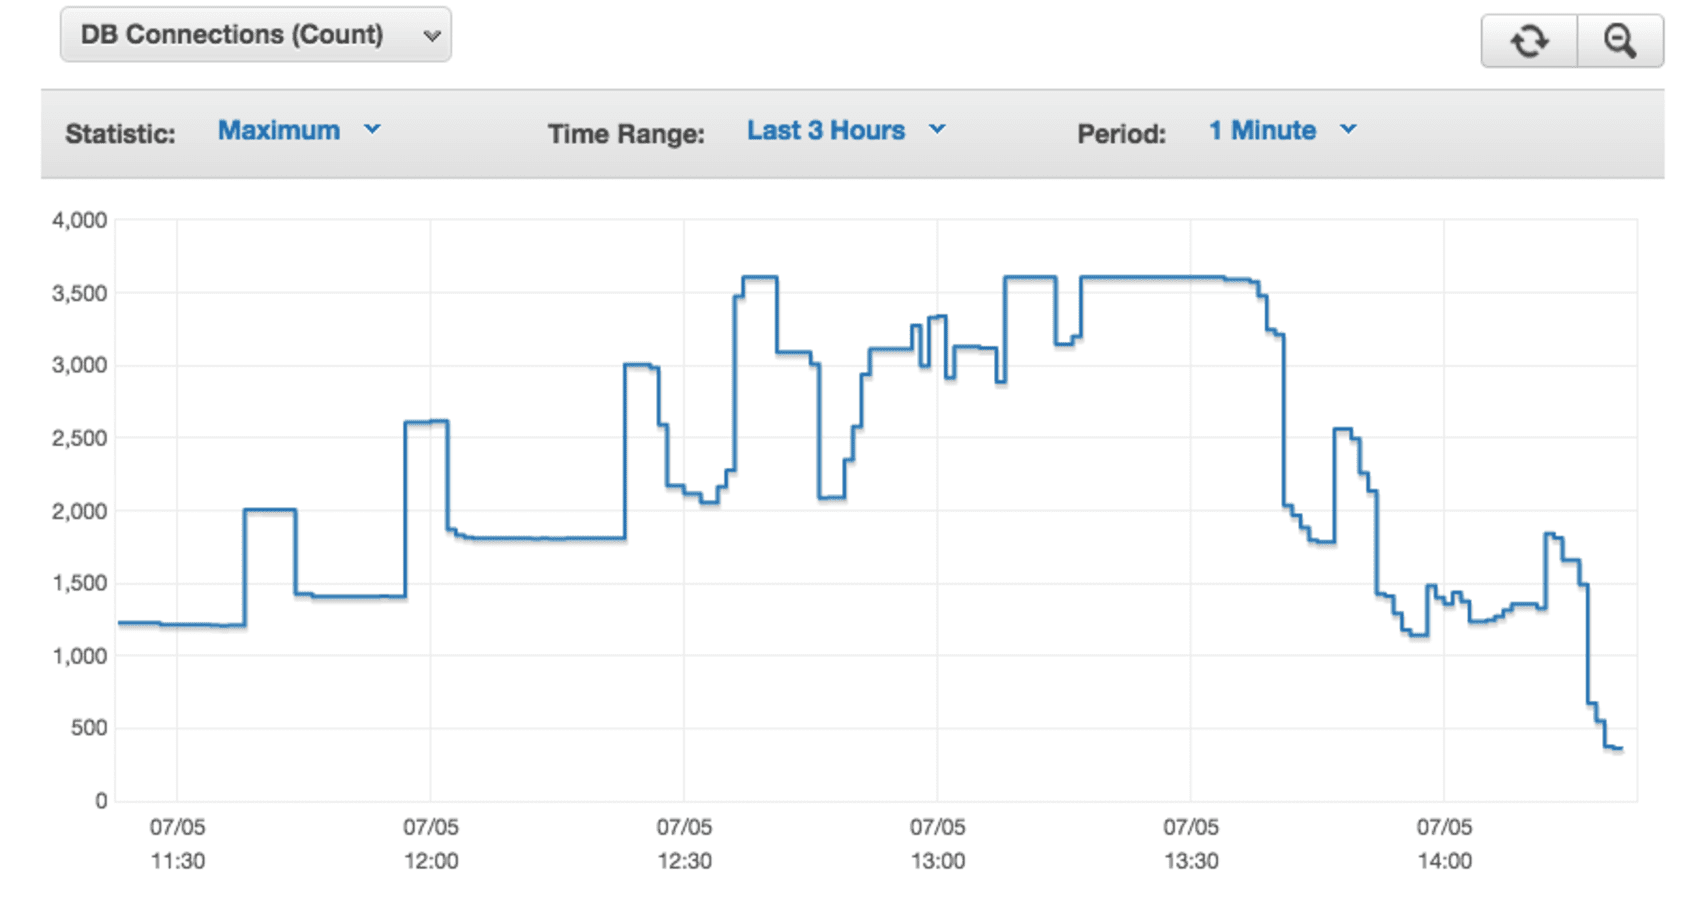
Artifactory also exposes an MBean for DB Connections, so that you can monitor them using any JMX-compliant tool. If you are using JConsole, then this MBean can be found under: org.jfrog.artifactory > Artifactory > Storage: Data Source. Of course there are many other tools you can use to monitor your database connections. For example, the graph below shows a database usage spike recorded by the AWS monitoring tool of the RDS database..
Netstat can also be utilized here to monitor active DB connections ( replace DB_PORT with your Artifactory’s database port):
while sleep 5; do printf "$(date) DB Connections: $(netstat -latuen | grep DB_PORT | wc -l)"; echo; done
You may also specify which state that you’d like to count. For example, you may count the number of LISTEN states by running the following command (replace DB_PORT with your Artifactory’s database port):
while sleep 5; do printf "$(date) DB Connections: $(netstat -latuen | grep DB_PORT | grep LISTEN| wc -l)"; echo; done
If you see that your database connections are consistently near the maximum value, you will likely need to increase it accordingly. If the number of active database connections reaches the maximum value, and more database connections are requested, the Artifactory server log ( $ARTIFACTORY_HOME/logs/artifactory.log) will yield the following exception:
org.springframework.transaction.CannotCreateTransactionException: Could not open JDBC Connection for transaction; nested exception is org.apache.tomcat.jdbc.pool.PoolExhaustedException: [art-exec-672866] Timeout: Pool empty. Unable to fetch a connection in 120 seconds, none available[size:100; busy:100; idle:0; lastwait:120000].
You may also see a degradation of performance due to an increased number of database connections that are waiting to get their place in the idle queue (pool.max.idle, which is explained in the next section). You may confirm this by doing a thread dump and looking for the number of threads that are parked with: org.apache.tomcat.jdbc.pool.ConnectionPool.returnConnection.
Tuning
In Artifactory: Artifactory’s database connections can be configured by setting following parameters in the $ARTIFACTORY_HOME/etc/db.properties file:
- pool.max.active: the maximum number of concurrent database connections allowed (default is 100)
- pool.max.idle: the maximum number of idle database connections that Artifactory will hold (default is 10)
In the database: Increasing the number of connections in the database itself is equally important and you should refer to the documentation for the database you are using. In addition to monitoring and modifying database connections, there are other settings which come into play when it comes to database performance. For some tuning examples, our MySQL documentation includes suggestions for your my.cnf file, so that you can tune MySQL for optimal performance. For PostgreSQL, you can find out more about tuning in the PostgreSQL wiki where you can also learn about how to increase your max_connections setting.
JVM Memory
When optimizing Artifactory, you also need to consider memory. If there is insufficient memory allocated to Artifactory, a number of issues can arise such as a sluggish UI, slow responses, and in the worst case scenario, a completely unresponsive Artifactory. To avoid running into memory consumption issues you can modify the Artifactory JVM settings.
Monitoring
Please note that when monitoring the historical data of JVM usage, it is important to make the initial heap size (Xms) less than the maximum heap size (Xmx), otherwise it will be difficult to see usage patterns in graphs.
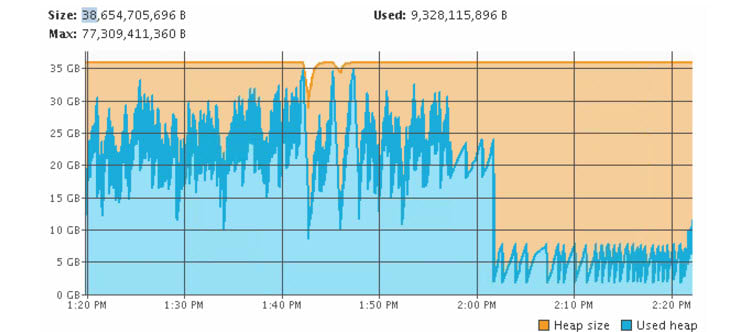
A number of the tools previously discussed (e.g. JConsole, JVisualVM, Javamelody, etc.) can also be used to monitor JVM usage.
Tuning
Since the number of users and size of repos has a direct impact on memory use and performance, when optimizing Artifactory, we recommend checking out the recommended hardware guidelines in the Artifactory User Guide when modifying JVM parameters.To modify the JVM memory allocation, please refer to the corresponding instructions for Linux, Solaris or Mac, or Windows.
Storage
Storage is another imperative resource that needs to be monitored, as a lack of storage can be detrimental to performance and stability.
Monitoring
Disk IO rate: A slow disk IO rate can cause significant degradation in performance, but there are different tools you can use to monitor this. In the example below, iostat is being used to monitor the IO rate. We recommend that this testing be performed before installing/configuring any Artifactory instance. Add the -d flag to only show the device information page, and -x for detailed information (separate read/write stats); add 1 for continuous output. Below is an example output:
$ iostat -dx 1

Device:         rrqm/s   wrqm/s     r/s     w/s    rkB/s    wkB/s avgrq-sz avgqu-sz   await r_await w_await  svctm  %util

xvdb              0.00     0.00  649.00    0.00 55808.00     0.00   171.98     8.13   12.44   12.44    0.00   1.54 100.00
Disk Space: Artifactory exposes an MBean that lets you monitor Storage which can be found under org.jfrog.artifactory > Artifactory > Storage. For Enterprise installations, JFrog Mission Control provides a central dashboard from which you can monitor storage (and more) for all your global Artifactory instances in one place. You can read more using Mission Control to track storage usage using Mission Control in this blog post.
Tuning
Should you find that your existing filestore (e.g. S3, NFS, etc.) is slow, and if you also have a local filestore which is faster and smaller (e.g. a solid state drive), then Artifactory’s cache-fs can help. Cachefs works like a file system but also has a binary LRU (Least Recently Used) cache for upload and download requests. Enabling Cachefs can significantly improve the performance of instances with high IOPS (I/O Operations) or slow NFS access. For more information on how to configure this, please refer to Cached Filesystem Binary Provider in the Artifactory User Guide.
If you find that your disk is running low on space, you can either move the current filestore to a new storage solution. One option is to use one of the supported cloud storage providers (S3, GCS or Azure) which will give you massively scalable storage. Another option is to add storage using Artifactory’s Filestore Sharding feature which you can configure to use either a redundant or non-redundant setup to achieve a stable, reliable, and scalable filestore. For more tips on tweaking how Artifactory uses disk space, check out in the User Guide.
Generally, when it comes to optimizing Artifactory, one size does not fit all. By Monitoring your setup, you can tweak your system and settings appropriately so that your Artifactory instance can reach its optimal performance. We also recommend that you perform stress tests for tuning. You can use the Artifactory Query Language (AQL) or JFrog CLI to loadtest concurrent uploads and downloads; using the CLI’s “–threads” option to test multithreaded uploads and downloads .


