Predictive Graphs and Notifications
In my last post about JFrog Mission Control, I introduced the new Graphs feature which shows how your instances and repositories have been consuming storage. Knowing your history can help you prepare for the future, but why should you have to second-guess what will happen? Mission Control now does that for you with predictive graphs.
The future at your fingertips
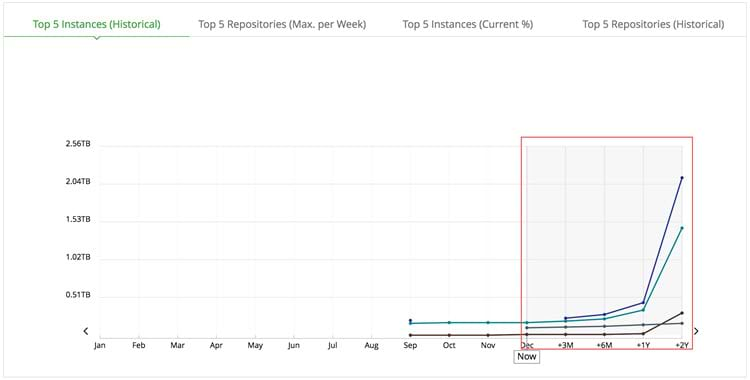
Mission Control analyzes your storage data over time, and when you view the different storage graphs, it will do a predictive analysis to extrapolate the graphs 3, 6, 12 and 24 months into the future giving you an estimation and heads-up about what you might need to prepare for. Wouldn’t you like to have at least 3 months to prepare for (and therefore avoid) a storage crunch rather than scrambling for disk space when it happens?
Your personal assistant
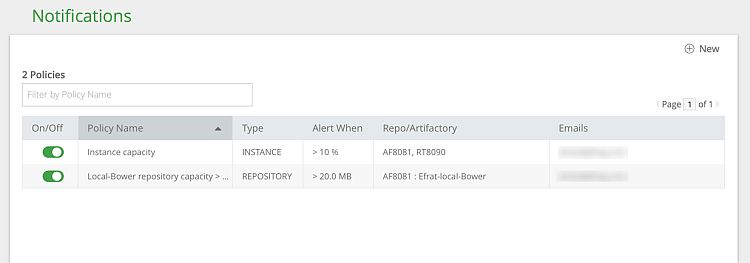
Extrapolating usage patterns into the future is great to prepare for regular day-by-day activity down the line, but it doesn’t help with current peaks of activity. If there’s a overnight surge in consumption of storage on one of your instances or repositories, you might want to know about it when you get in next morning. Mission Control will now issue email notifications according to different policies you set. These policies let you set both the high and low watermarks that will trigger an email notification so you can get notified if there’s a crunch on storage, and then again once storage is freed up.
So if you don’t yet have a personal assistant who can look into the future, download Mission Control.


